Repeated exercise tests have been one of the most intriguing topics of research on myalgic encephalomyelitis/chronic fatigue syndrome (ME/CFS). However, many 2-day exercise studies are limited by small sample sizes and suffer from discrepancies. A brief overview.
Conflicting values
Researchers from the University of the Pacific were the first to report that ME/CFS patients fail to replicate their exercise results. In 2007, Van Ness and colleagues found no significant differences between the ME/CFS and control group on the first cardiopulmonary exercise test (CPET). However, when the test was repeated the next day, ME/CFS patients showed significantly lower values on multiple outcomes. CPET has good reproducibility in healthy people and various patient groups, so these findings were surprising. Van Ness and colleagues believed that this peculiar failure to reproduce exercise results reflected post-exertional malaise. The changes they found for ME/CFS patients were quite large. Peak VO2 values dropped by approximately 5.7 ml/kg min, almost 25% compared to the first test.
The same research group followed up on their findings with a bigger study of 51 ME/CFS patients and 10 controls. The results were published in Snell et al. in 2013. The decline in peak VO2 was much smaller now and not significantly different compared to controls but the drop in another outcome, Workload VT (the power pushed at the ventilatory threshold), was enormous. While controls increased their watts on the second test, the ME/CFS patients decreased from 49.51 to 22.2 watts, or by more than 50%. This massive difference is substantially higher than in other 2-day exercise studies.
There are reasons to think the data contains an error. The University of the Pacific group published an analysis of the same data seven years later, in Davenport et al. 2020. The summary statistics match up except for one big difference: in the 2020 paper, Workload VT dropped from 49.5 to 44.1 watts (rather than 22.2 watts), or a decrease of approximately 11%. That seem more realistic and is more in line with what other studies found.
Unfortunately, two reviews had already used the older figures with a decrease of more than 50%. One of these reviewers, Dr. John Derek Franklin from Teesside University, contacted the Pacific group. While they confirmed that both papers used the same dataset, they could not clarify the difference in workload VT values. One of the figures must be wrong but it is unclear which one. Given that the 2013 paper is older and that it reports an extreme value (22 watts for workload VT is quite low) we suspect this data is incorrect.
| Study | Population | Sample size | VO2 peak (ml/kg min) | VO2 VT (ml/kg min) | Work peak (Watt) | Work VT (Watt) |
| VanNess 2007 | ME/CFS | 6 | -5.76 (-22.0%) | -4.00 (-26.0%) | / | / |
| Van Ness 2007 | Controls | 6 | +0.47 (+1.7%) | +0.45 (+2.6%) | / | / |
| Vermeulen 2010 | ME/CFS | 15 | -1.40 (-6.3%) | -0.90 (-7.0%) | -7.00 (-5.3%) | -4.10 (-7.0%) |
| Vermeulen 2010 | Controls | 15 | +0.7 (-2.2%) | +1.30 (+7.8%) | +8.00 (+4.3%) | +10.00 (+12.1%) |
| Keller 2014 | ME/CFS | 22 | -3.30 (-13.8%) | -2.30 (-15.8%) | -17.00 (-12.5%) | -10.00 (-21.3%) |
| Hodges 2017 | ME/CFS | 10 | +1.32 (+5.3%) | +1.27 (+6.1%) | -9.00 (-6.7%) | -12.00 (-11.4%) |
| Hodges 2017 | Controls | 17 | +1.07 (+3.3%) | +4.90 (+20.8%) | +3.00 (1.8%) | 13.00 (10.9%) |
| Nelson 2019 | ME/CFS | 16 | +0.10 (+0.4%) | -0.50 (-3.1%) | -1.90 (-1.2%) | -15.30 (-17.4%) |
| Nelson 2019 | Controls | 10 | +0.40 (+1.3%) | -0.60 (3.6%) | +2.00 (1.2%) | -2.50 (-2.8%) |
| Lien 2019 | ME/CFS | 18 | -1.21 (-5.0%) | -0.86 (-7.0%) | -6.10 (-3.9%) | -7.79 (-14.8%) |
| Lien 2019 | Controls | 15 | -0.94 (-2.6%) | -0.17 (-1.0%) | -4.57 (-2.1%) | -0.39 (-0.5%) |
| Davenport 2020 | ME/CFS | 51 | -1.00 (-4.7%) | -1.30 (-10.2%) | -9.40 (-8.6%) | -5.40 (-10.9%) |
| Davenport 2020 | Controls | 10 | -1.00 (-4.0%) | +0.30 (+2.2%) | +2.80 (+2.0%) | +5.50 (9.5%) |
| Van Campen 2020 A | ME/CFS | 25 | -3.00 (-10.0%) | -4.00 (-22.0%) | -19.00 (-10.0%) | -31.00 (-30.0%) |
| Van Campen 2020 B | ME/CFS | 82 | -1.63 (-9.4%) | -2.38 (-20.5%) | -16.62 (-14.5%) | -18.89 (-29.6%) |
| Van Campen 2021 A | ME/CFS | 26 | -3.00 (-11.5%) | -4.00 (-26.7%) | -20.00 (-10.3%) | -26.00 -(27.1%) |
| Van Campen 2021 A | Controls | 25 | +3.00 (-10.7%) | +2.00 (+15.4%) | +13.00 (+6.0%) | +14.00 (+17.3%) |
| Van Campen 2021 B | ME/CFS | 51 | -2.00 (-9.5%) | -3.00 (-23.1%) | -15.00 (-11.4%) | -19.00 (-29.7%) |
| Van Campen 2021 B | Controls | 50 | +2.00 (+9.1%) | +2.00 (+18.2%) | +2.00 (+1.4%) | +6.00 (+5.6%) |
| Keller 2024 | ME/CFS | 84 | -1.10 (-5.3%) | -0.70 (-6.8%) | -6.90 (-5.5%) | -4.80 (-9.4%) |
| Keller 2024 | Controls | 71 | -0.30 (-1.3%) | -0.90 (-7.0%) | -3.00 (-2.0%) | -2.40 (-3.4%) |
Too many zero’s
There is also something amiss with a Norwegian 2-day exercise test study, published in 2019 by Lien and colleagues. The exact numbers were not reported but shown in a couple of figures that plotted the data points and the differences between test 1 and test 2 for each participant. For workload VT, however, the graph (figure 5 D) looks rather peculiar. 11 out of 14 control participants are shown to have a difference between test 1 and test 2 of exactly 0. Two others have a difference of 10 and the last two have a difference of -10. The ME/CFS data shows a similar peculiar arrangement with many participants having the same value.
This pattern is very unlikely. From other studies, we know that differences between test 1 and test 2 are scattered all over the place with quite some variation in both patients and controls. In his review, Franklin noted this abnormality as well. He wrote: “These results seemed highly improbable and therefore the Lien research team were contacted directly to clarify these findings However, this data was unable to be verified with the Lien research group and therefore this data set was excluded from the analysis.”
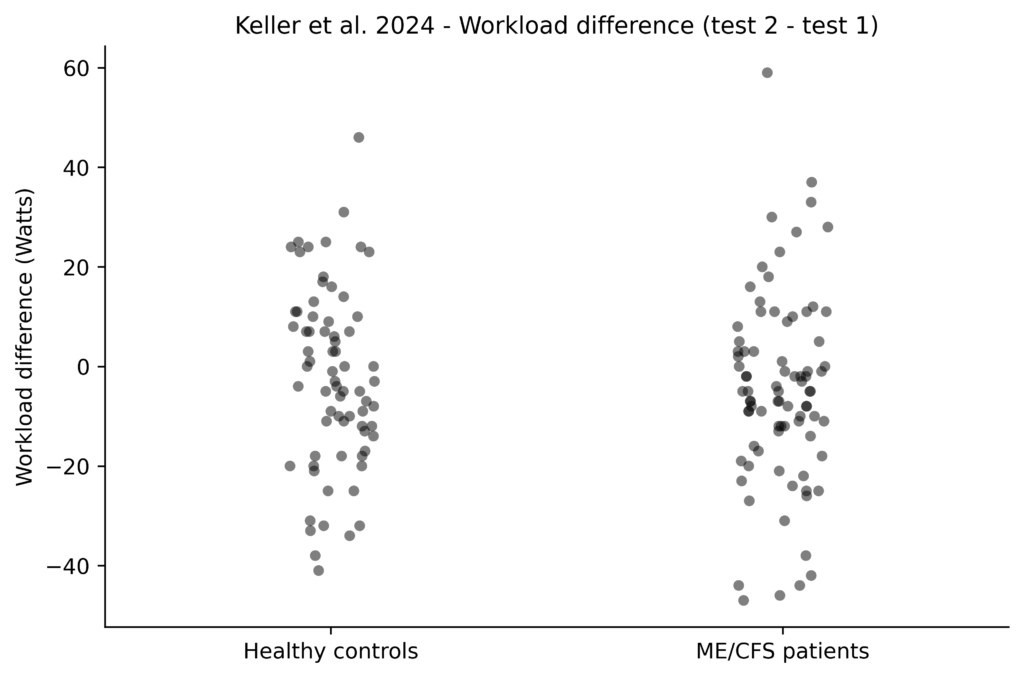
One potential explanation might be that the differences are somehow rounded to the nearest 10 watts but that would not explain why so many controls were close to zero. In the recent study by Keller and colleagues (the biggest study on 2-day exercise testing to date), the differences ranged from approximately -40 to 40 watts with only a small portion of participants scattered around 0.
Perfect separation
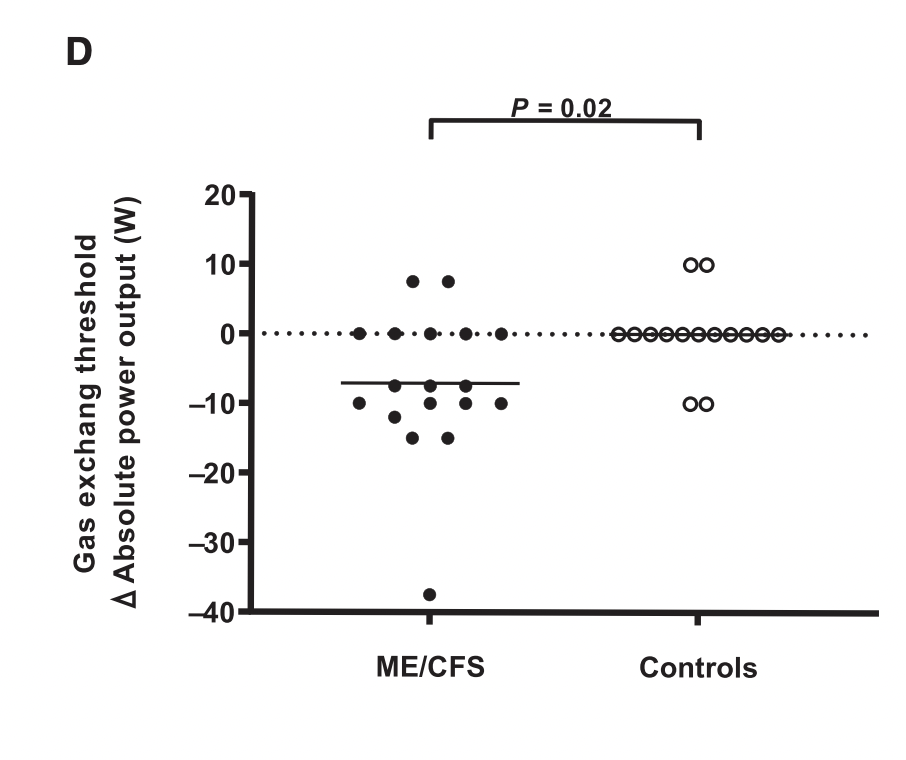
A third problem is found in the studies of Dutch cardiologists Linda van Campen and Frans Visser. One of their papers contains data on 2-day exercise testing in 26 males with ME/CFS and 25 patients with chronic fatigue who did not meet the full ME/CFS criteria and were therefore diagnosed with idiopathic chronic fatigue (ICF). The data for these groups shows almost perfect separation: all MECFS patients declined while all ICF improved at the second test. Such a pattern is extremely unlikely to have happened by chance, especially considering that it occurs on multiple outcome measures.
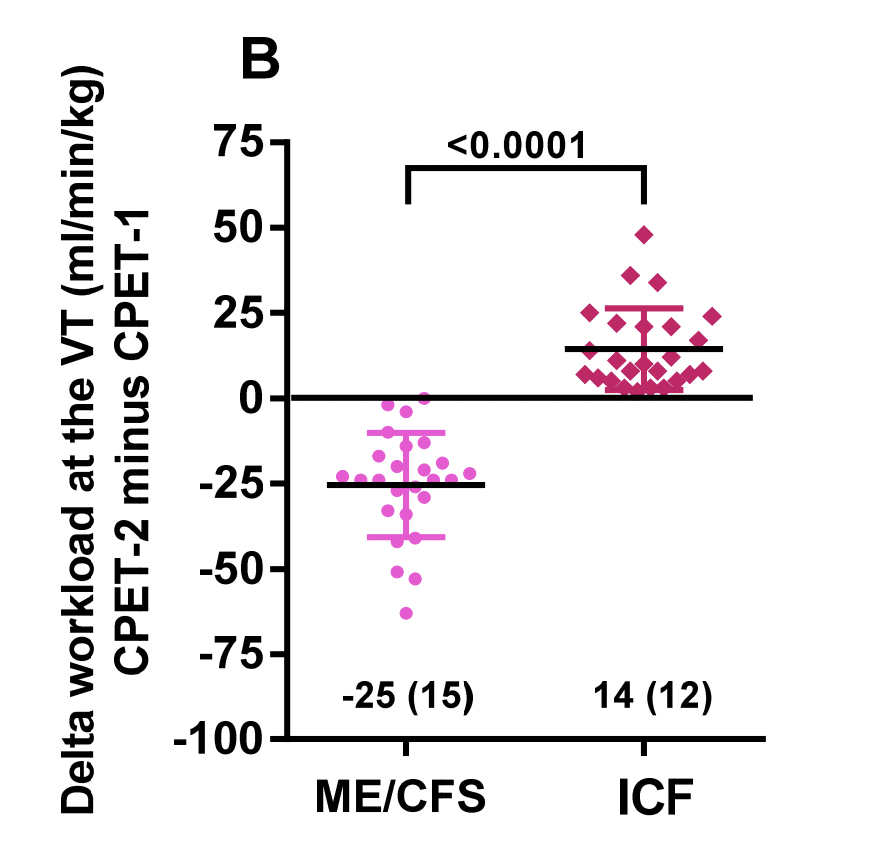
The only plausible explanation for such a perfect separation is that the data on 2-day exercise testing were used to make the diagnosis of ME/CFS (for example for assessing PEM). If that is the case, then this dataset is unable to tell us much about 2-day CPET differences between ME/CFS patients and controls. Any attempt to do so would amount to circular reasoning.
Van Campen and colleagues published similar data on 51 female ME/CFS patients and 50 ICF controls in a separate paper. In this dataset, there is some overlap between the groups, but the data still looks unlikely to have occurred naturally.
Conclusion
As Table 1 shows, ME/CFS patients often have a significant decrease in their workload at the ventilatory threshold while no such decrease (or even an increase) is seen in controls. The differences between test 1 and test 2 range from approximately -4 to -30 watts in absolute terms or -7% to -30% in relative terms*. Unfortunately, most 2-day exercise studies are small with various inconsistencies. Bigger and higher-quality studies will be needed to test if this finding can be replicated and reflects ME/CFS pathology.
Notes
*One needs to be careful with percentages of mean differences because this does not always correspond to the mean percentage difference. Taking the means first and then their percentage change is sometimes different from taking the percentage change per participant and then taking the mean. In the Keller et al. dataset, for example, the percentage change of workload VT in the ME/CFS group is -9.4% but if you calculate the mean percentage change it’s close to zero (0.08%). This is due to extreme outliers with low values on test 1 who had large percentage increases. For most other outcomes, however, the difference between the two calculation methods is not as large as for workload VT.
I partly disagree with the conclusion. Do we really need more studies (when these findings (WR and VO2 at peak and VT1) are showing something is wrong in many patients, but are studies so far are showing that this method is unlikely to have the very high accuracy we desire and is not suitable as a diagnostic tool for many patients due to the burden it imposes?
I suggest scientists move on and focus on other methodology to explain why this is happening in the first place, I know of novel methods during exercise challenges utilising EMG, MMG fatigue thresholds, and TMS to stimulate motor evoked potentials and specifically examine the relationship between peripheral fatigue, type III/IV muscle afferent feedback (which leads to reduction of motor cortex excitability) and the resulting central fatigue.
Thanks for your comment. Most of the 2-day exercise studies are quite small and exploratory. The Keller et al. 2024 study did not find a clear effect so I think a further replication study for VO2 and Workload is necessary before moving forward to try to explain the effect. Ideally this should be a multi-site study by researchers skeptical of the claim.