The largest study on repeated cardiopulmonary exercise testing in myalgic encephalomyelitis/chronic fatigue syndrome (ME/CFS) could not find a strong effect. Declines during the second exercise test are also present in many healthy controls and do not correlate well with functional disability. These results question the validity of 2-day exercise testing as a diagnostic biomarker for ME/CFS or post-exertional malaise.
However, this may not be the end of the story. ME/CFS patients decline more than controls on most outcomes and the data on VO2 peak and workload at the ventilatory threshold are consistent with a small to moderate effect.

Introduction
Repeated exercise tests performed on consecutive days have been one of the most exciting approaches in ME/CFS research during the past 15 years. Exercise testing offers an objective measure of cardiopulmonary fitness and study participants can normally reproduce their results on the second day. Since 2007, however, multiple studies reported that ME/CFS patients cannot replicate their exercise results, a curious finding that is thought to reflect post-exertional malaise (PEM), a key feature of the illness. ME/CFS patients report a marked functional decline and increase in symptoms when they exceed their energy limits. By performing two exercise tests with only 24 hours in between, researchers hope to find an objective measure of this PEM phenomenon.
One study, for example, argued that declines on the 2nd day exercise test “may represent an objective biomarker that can be used to assist with the diagnosis of ME/CFS.” Another group claimed that 2-day exercise testing “offers objective evidence of impairment attributable to the effects of PEM, helps with patient management, informs therapeutic interventions, and tracks illness progression.” Despite the excitement and bold claims, most of the 2-day exercise studies conducted have been extremely small, often with fewer than 20 ME/CFS participants.
The biggest study to date
In July 2024, however, the research team of Dr. Betsy Keller published the largest study on 2-day exercise testing to date. 84 ME/CFS patients were recruited by expert clinicians John Chia, Susan Levine, and Geoff Moore using the Canadian Consensus Criteria. 71 Sedentary but healthy participants were included as the control group. The authors matched 55 ME/CFS patients and controls for age, sex, and fitness to ensure that these factors could not influence the results. Keller and colleagues also made their data publicly available (which should be but is not common practice in medical research) on mapmecfs.org. This allows other researchers (and the authors of this blog) to analyze the data themselves.
In their paper, Keller and colleagues report that ME/CFS patients fail to reproduce many exercise outcomes on the second test and that this substantiated impaired recovery in ME/CFS. However, the authors compared exercise measures between groups (ME/CFS patients versus controls) and between tests (CPET1-CPET2) but not both simultaneously. It’s this interaction that we are interested in. We would like to know if changes between two exercise tests are different in ME/CFS patients versus controls. If ME/CFS patients’ results decline, for example, by 10%, we would like to know how often this occurs in controls and if the difference could have happened by chance.
VO2 peak: the largest effect
The graph below shows the changes seen for VO2; the maximal amount of oxygen consumed during the exercise test. Because oxygen is crucial for producing energy during sustained efforts, VO2 is seen as a measure of general fitness. It is usually expressed relative to body weight. Of all outcomes Keller and colleagues tested, the peak values for VO2 showed the strongest effect.
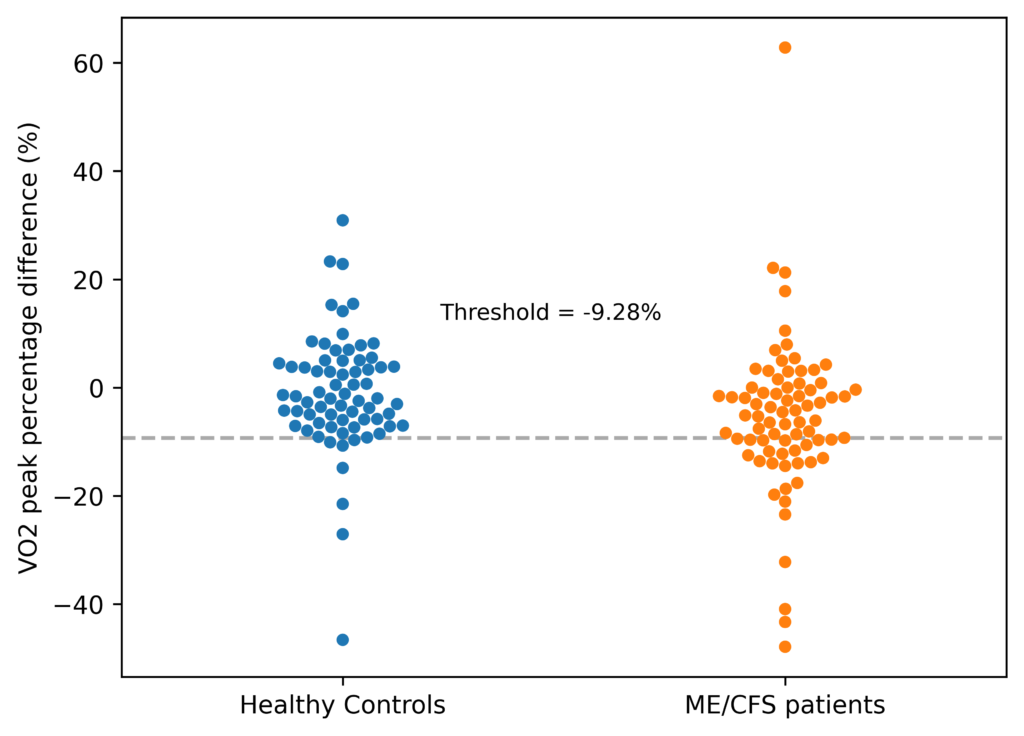
As the graph above shows, the results of ME/CFS patients (in orange) declined more than the control group (in blue). We use percentage differences so that each participant’s results carry equal weight, regardless of their baseline value. The median change for the ME/CFS group was -5.1% compared to -2% in controls. On average if you randomly chose a participant from each group and compared their percentage change from test 1 to test 2, the ME/CFS value will be lower 64% of the time. That suggests a moderate effect (no effect would mean a 50/50 chance of being lower).
The graph, however, also shows a large overlap between the two groups. The threshold that best separates them is a value of -9.3% as shown by the dashed gray line. Approximately a third of ME/CFS patients are under this line (sensitivity), while 90% of controls are above it (specificity). These numbers suggest this outcome has great difficulty in differentiating ME/CFS patients and controls and that it does not have strong potential as a diagnostic biomarker.
Multiple testing problem
There are several additional issues. First, there is the multiple testing problem. Researchers use statistical tests to study if an effect might have occurred by chance. They first assume there is no difference between the two groups (the null hypothesis) and then calculate how likely we would find data like the one in the graph above where one group has (slightly) lower values. For the VO2 peak difference, there is only a 0.5% chance of observing a difference as extreme as the one found if there is truly no difference between the groups (Mann-Whitney, p = 0.005). Only 1 in 200 times would we falsely conclude that there is an effect when it happened just by chance.
That seems solid but because Keller and colleagues tested over 20 outcomes at two different time points (at peak exercise and the ventilatory threshold), there is an increased risk of false positives that we must account for. Using the Benjamini-Hochberg method to control the false discovery rate, we estimate that the chance of a false positive result for VO2 peak could be as high as 8-20%, depending on the type and number of tests considered. In other words, while the data is consistent with a moderate effect, it does not provide strong enough evidence to exclude that it happened by chance and random variation. VO2 measured at another timepoint (the ventilatory threshold) also showed a weaker effect that was not significantly different between both groups (Mann-Whitney, p = 0.18, see table 2).
| Outcome | Common-Language Effect Size (CLES) | p-value Mann_Whithey | Benjamini–Hochberg corrected p-values | Cohen’s d Winsorized data (2.5%) | p-value Welch test Winsorized data (2.5%) | Benjamini–Hochberg corrected p-values |
| VO2 | 0.64 | 0.005 | 0.1 | 0.48 [0.14, 0.81] | 0.004 | 0.08 |
| time_sec | 0.62 | 0.012 | 0.12 | 0.41 [0.08, 0.74] | 0.015 | 0.15 |
| Ve_BTPS | 0.59 | 0.052 | 0.3 | 0.38 [0.05, 0.71] | 0.025 | 0.16 |
| O2_pulse | 0.59 | 0.062 | 0.3 | 0.31 [-0.02, 0.64] | 0.064 | 0.21 |
| Workload | 0.58 | 0.093 | 0.3 | 0.25 [-0.08, 0.58] | 0.127 | 0.31 |
| VCO2 | 0.58 | 0.099 | 0.3 | 0.36 [0.03, 0.69] | 0.031 | 0.16 |
| HR | 0.58 | 0.12 | 0.3 | 0.23 [-0.1, 0.56] | 0.173 | 0.31 |
| HR_predicted | 0.58 | 0.12 | 0.3 | 0.23 [-0.1, 0.56] | 0.173 | 0.31 |
| DBP | 0.59 | 0.188 | 0.42 | 0.33 [-0.0, 0.66] | 0.053 | 0.21 |
| Vt_BTPS_L | 0.55 | 0.306 | 0.52 | 0.15 [-0.18, 0.48] | 0.374 | 0.58 |
| RPP | 0.56 | 0.308 | 0.52 | 0.24 [-0.09, 0.57] | 0.16 | 0.31 |
| RR | 0.55 | 0.31 | 0.52 | 0.26 [-0.07, 0.59] | 0.125 | 0.31 |
| RPE | 0.66 | 0.369 | 0.57 | 0.11 [-0.22, 0.44] | 0.526 | 0.66 |
| RER | 0.54 | 0.416 | 0.59 | 0.12 [-0.21, 0.45] | 0.466 | 0.64 |
| Ve_VCO2 | 0.53 | 0.492 | 0.66 | 0.15 [-0.18, 0.48] | 0.362 | 0.58 |
| SBP | 0.54 | 0.532 | 0.66 | 0.12 [-0.21, 0.45] | 0.477 | 0.64 |
| Ve_VO2 | 0.51 | 0.789 | 0.9 | 0.01 [-0.32, 0.34] | 0.933 | 0.95 |
| PETO2 | 0.5 | 0.841 | 0.9 | 0.04 [-0.29, 0.37] | 0.82 | 0.91 |
| PP | 0.5 | 0.896 | 0.9 | 0.01 [-0.32, 0.34] | 0.954 | 0.95 |
| PETCO2 | 0.51 | 0.9 | 0.9 | 0.05 [-0.28, 0.38] | 0.76 | 0.89 |
No correlation with disability
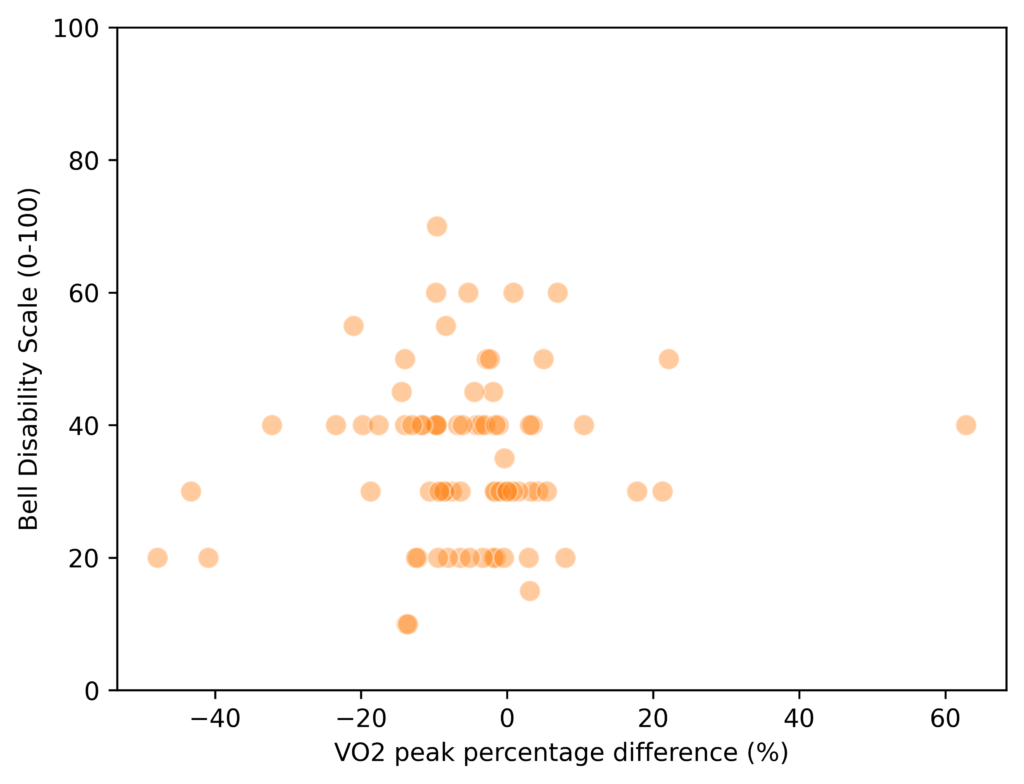
Second, VO2 peak differences between test 1 and test 2, do not correlate well with impairment. Keller and colleagues used the Bell disability scale where participants could indicate their disability using a number from 0 (bedridden) to 100 (no symptoms). The VO2 peak differences within the ME/CFS group show no significant correlation with scores on the Bell scale (Spearman rho = -0.009, p = 0.94), questioning their clinical significance.
Third, there is an inconsistency with previous studies. A 2022 meta-analysis of 6 case-control studies on 2-day exercise testing in ME/CFS, found only a tiny effect for VO2 peak values (Cohen’s d = -0.23), which was not statistically significant. Previous studies pointed towards another measure as the most consistent finding where the effect was substantially larger: workload at the ventilatory threshold.
Workload VT
Workload refers to power, the number of watts, you push during the exercise test, usually on a stationary bike. The ventilatory threshold (VT) is the point where the rate of breathing increases disproportionately to oxygen consumption. This suggests the body is transitioning from aerobic energy production (which relies on oxygen) to a greater reliance on anaerobic metabolism (which produces lactate and CO2 as a byproduct). This ventilatory threshold has been suggested to be more relevant to the everyday life with ME/CFS because patients rarely perform activities at maximal intensity.
| Outcome | Common-Language Effect Size (CLES) | p-value Mann_Whithey | Benjamini–Hochberg corrected p-values | Cohen’s d Winsorized data (2.5%) | p-value Welch test Winsorized data (2.5%) | Benjamini–Hochberg corrected p-values |
| PETCO2 | 0.62 | 0.042 | 0.44 | 0.28 [-0.05, 0.6] | 0.085 | 0.36 |
| Workload | 0.60 | 0.044 | 0.44 | 0.16 [-0.16, 0.48] | 0.318 | 0.63 |
| Ve_VCO2 | 0.58 | 0.082 | 0.53 | 0.32 [-0.0, 0.64] | 0.045 | 0.36 |
| time_sec | 0.57 | 0.145 | 0.53 | 0.02 [-0.3, 0.34] | 0.901 | 0.96 |
| PETO2 | 0.55 | 0.170 | 0.53 | 0.33 [0.01, 0.65] | 0.043 | 0.36 |
| VO2 | 0.56 | 0.184 | 0.53 | 0.23 [-0.09, 0.55] | 0.136 | 0.36 |
| O2_pulse | 0.57 | 0.186 | 0.53 | 0.25 [-0.07, 0.57] | 0.119 | 0.36 |
| Ve_VO2 | 0.55 | 0.248 | 0.62 | 0.29 [-0.03, 0.61] | 0.073 | 0.36 |
| VCO2 | 0.55 | 0.328 | 0.72 | 0.13 [-0.19, 0.45] | 0.408 | 0.68 |
| SBP | 0.55 | 0.360 | 0.72 | 0.26 [-0.06, 0.58] | 0.114 | 0.36 |
| Vt_BTPS_L | 0.54 | 0.416 | 0.73 | 0.10 [-0.22, 0.42] | 0.539 | 0.77 |
| PP | 0.55 | 0.438 | 0.73 | 0.24 [-0.08, 0.56] | 0.143 | 0.36 |
| RPP | 0.53 | 0.566 | 0.75 | 0.15 [-0.16, 0.47] | 0.344 | 0.63 |
| DBP | 0.54 | 0.600 | 0.75 | 0.11 [-0.21, 0.43] | 0.501 | 0.77 |
| RR | 0.51 | 0.611 | 0.75 | 0.15 [-0.17, 0.47] | 0.347 | 0.63 |
| Ve_BTPS | 0.52 | 0.647 | 0.75 | 0.01 [-0.31, 0.33] | 0.945 | 0.96 |
| HR_predicted | 0.53 | 0.678 | 0.75 | 0.03 [-0.29, 0.35] | 0.864 | 0.96 |
| HR | 0.53 | 0.678 | 0.75 | 0.03 [-0.29, 0.35] | 0.864 | 0.96 |
| RER | 0.50 | 0.973 | 0.99 | 0.02 [-0.3, 0.34] | 0.900 | 0.96 |
| RPE | 0.56 | 0.994 | 0.99 | 0.01 [-0.31, 0.33] | 0.958 | 0.96 |
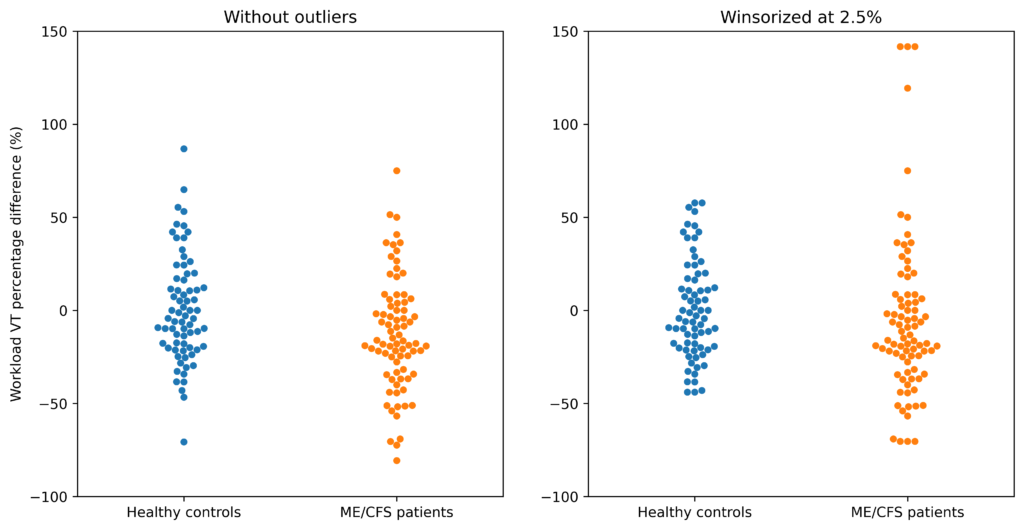
In contrast to previous studies, however, the data by Keller et al. do not show a clear difference for Workload VT. Here’s what the data looks like:
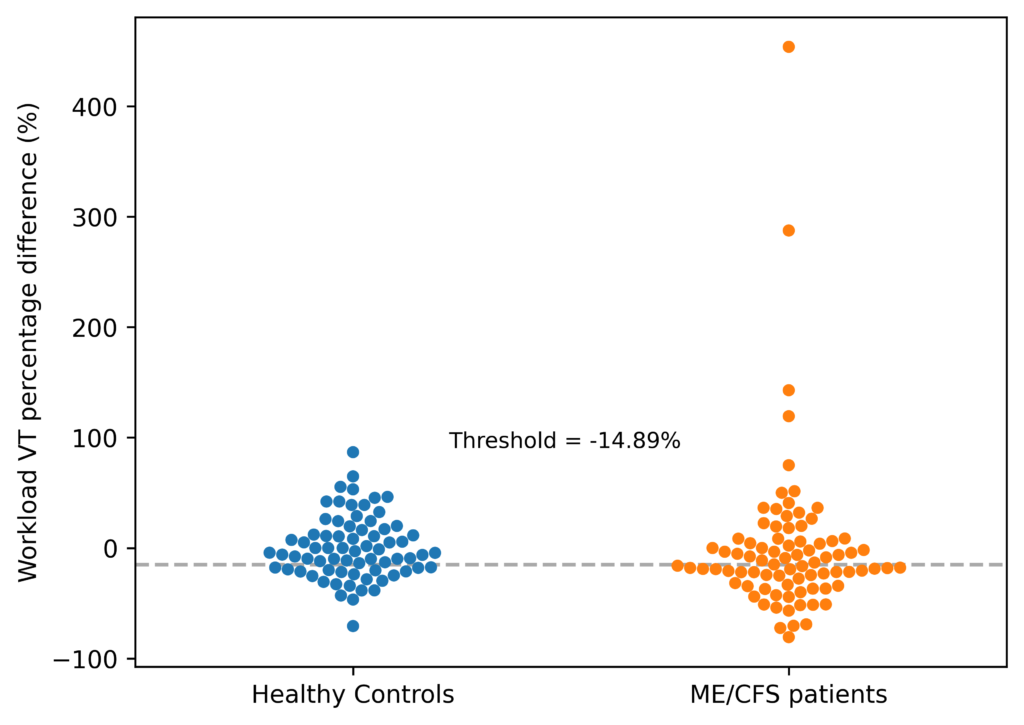
The first thing that stands out is that workload VT has much more variation than VO2 peak. While most of the percentage changes on VO2 peak were between -40% and +40%, the workload VT changes lie between -100% and +100%. There are even 4 outliers that lie outside this range (more on that later).
The overlap between the ME/CFS and control group is also bigger. A previous Australian study suggested using a threshold of -9.8% as “a reduction of this magnitude is not likely to occur in a person who does not have ME/CFS.” In the data by Keller and colleagues, however, almost 40% of controls did have this decline while only 53% of ME/CFS patients did. The calculated optimal threshold that best separated the groups was -14.9%. Half of ME/CFS patients are under this line (sensitivity) while approximately 70% of controls are above it (specificity).
The ME/CFS participants have lower values than controls, but the effect is smaller than for VO2 peak. If you randomly picked a ME/CFS patient and control, the former would have a lower percentage change, 59 times out of 100. Such an effect would occur 4.5% of the time even if there was no difference (Mann-Whitney, p=0.045), and is not statistically significant after correction for multiple tests. The differences also do not correlate well with the Bell disability scale (Spearman R = 0.058, p = 0.60) and are weaker in the subgroup of matched pairs (Mann-Whitney, p=0.346). The peak values of workload also showed a weaker effect that was not significantly different between groups (Mann-Whitney, p=0.093, see table 1).
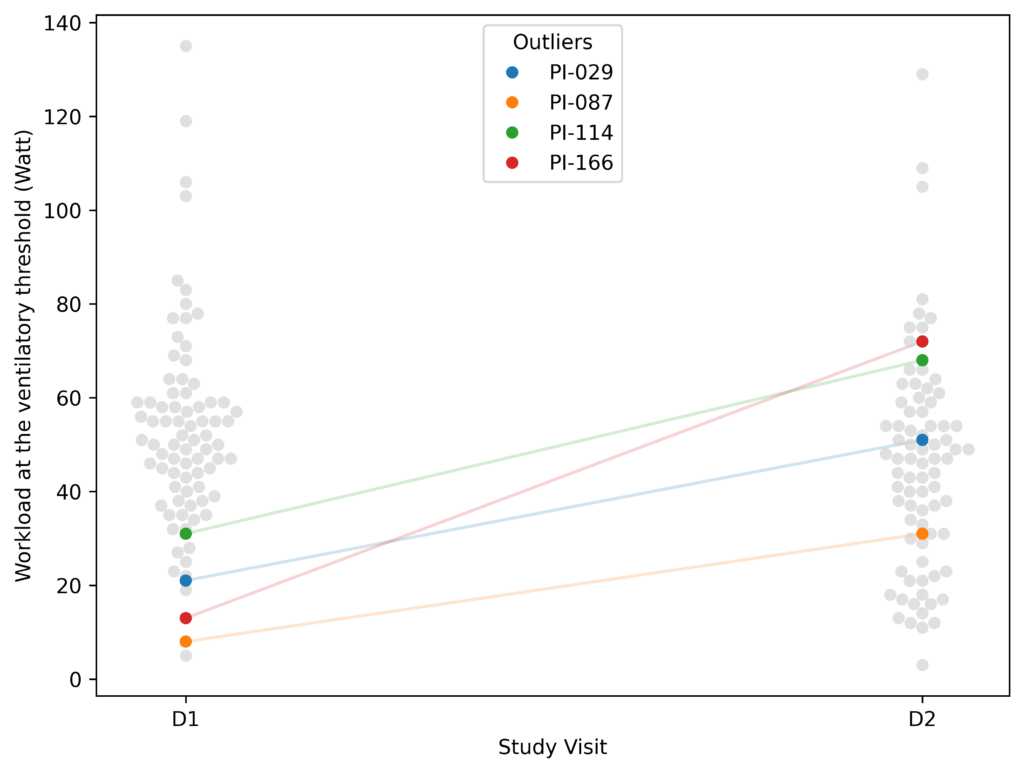
The outliers
The four outliers deserve further attention because they distort the graph and an increase of more than 100% on the second exercise test is rather bizarre. If we were to remove them, the effect size would increase to that of Peak VO2 with a corresponding Mann-Whitney p-value of 0.009.
However, removing data without a clear justification is controversial. If we look at these 4 participants’ absolute values, we see that they likely do not represent a measurement error. They moved up from the lower end to the middle and top of the ME/CFS group.
These outliers are partly a result of working with percentages rather than absolute changes. Other outcomes also suffer from these outliers (although not as extreme as Workload VT). We dealt with them in two ways: first, we used non-parametric tests based on ranks (instead of tests that rely on means) in our main analysis. Second, we also tried a method (Winsorizing at 2.5%) that replaces the extreme values with the nearest data points that are not considered outliers. With both methods, the results for Workload VT are not statistically significant. Whether there is a significant effect for Workload VT, depends on how you handle the 4 outliers.
Criteria for maximal effort
We continue with some general comments on the dataset. Overall, results were quite similar in the subgroup of pairs that were matched for age, sex and fitness. It appears that this did not have a strong influence on the results.
Keller and colleagues used criteria to determine if participants tried to exert themselves maximally during the test. These are based on objective measures such as the heart rate participants reached and the amount of CO2 they exhale, reflecting a reliance on anaerobic energy production. Keller and colleagues argued that they did not apply these criteria for ME/CFS patients on the second exercise test because failure to reach them may be part of the illness. Our analysis, however, showed that only 10 participants (8 ME/CFS patients and 2 controls) did not reach these criteria and that excluding them did not make much of a difference. Our analyses and graphs above were calculated with those 10 participants excluded.
The Keller et al. study did show interesting differences between ME/CFS patients and controls on a single exercise test. An example is a narrowed pulse pressure that has been reported in a previous study as well. Hopefully, these will provide further clues for research.
Future directions
Workload and VO2 have been studied the most and in the Keller 2024 study, they show some of the largest effect sizes. Future studies should focus on these measures to avoid the multiple testing problem.
While smaller, the effect of Workload VT is going in the same direction as in previous studies, supporting the hypothesis that ME/CFS patients fail to reproduce their power output on the second test. Future studies should try to reduce the large variation seen in Workload VT percentage changes to increase precision. Some suggestions made on the Science for ME forum include:
- matching patients and controls for workload rather than VO2. As extreme outliers were only found in participants with very low workload VT, this might have created an imbalance between the two groups.
- Decreasing the range at which participants are instructed to pedal. In the Keller study, it was 50-80 revolutions per minute. Perhaps this could be reduced to ensure participants cycle constantly at the same rate.
- Increasing the time period over which workload VT measurements are averaged. This is usually done automatically by the exercise bike equipment to provide stable readings. Increasing this interval might reduce the variation across different exercise tests.
We also recommend including more disability measures, particularly an assessment of PEM, so that we can more thoroughly test the relationship between exercise testing results and ME/CFS symptoms. It is striking that none of the 2-day exercise test studies thus far have included a measurement of PEM.
Conclusion
In conclusion, the largest and highest quality study on 2-day exercise testing did not find strong evidence of impaired recovery in ME/CFS patients. This suggests that the effects are smaller than initially thought and that the procedure has difficulty in accurately differentiating patients and controls. The data, however, are consistent with a small to moderate effect for VO2 Peak and perhaps for Workload VT as well, depending on how you analyse the data.
In a future blog post, we will take a closer look at previous studies of 2-day exercise testing in ME/CFS patients.
Acknowledgments
Many thanks to forestglip on the Science for ME forum whose thoughtful analysis was very helpful in understanding the Keller et al. dataset.
The following dataset was used from www.mapmecfs.org: Keller et al. Cardiopulmonary and metabolic responses during a 2-day CPET in ME/CFS. Last updated: September 12, 2024, 4:29 PM (UTC+02:00).
Its simple. They have no identified the malfunction so they cannot measure its development in response to activity. Saying someones heartbeat doesnt change is like saying we can feed a diabetic sugar & their heartbeat is normal.
Im overdoing things at the moment and all I can say is that I feel a straining feeling in my entire torso from activities I did 3 days ago. Its not muscular. Its to do with the internal organs & chemical production.
When I started overdoing things the effect was small. certainly in the first 48 hours. The measurement needs to be made on the second occassion of overdoing things when post exertional malaise is at its peak.
The way to do it is as follows.
Get the ME patient & control to do strenuous activity alongside each other doing the same amount until the ME patient feels very ill then rest for 24 hours. Then the ME patient and control again do a task togeheter. This is when you take the measurement. They continue the task until the ME patient reaches their limit. ..then at a 72 hour point you do it again.
After the 72 hour point the ME patient and control report their physical experiences when doing daily basic self care tasks. This shows the difference clearly then because the ME person will be getting huge straining feelings 48 hours after the 72 hour period whereas the control will be back to normal.
I am trying to understand the statement “ The authors matched 55 ME/CFS patients and controls for age, sex, and fitness”. Does this mean that all 55 participants are the same age, sex and fitness, or does it mean that for every 40 year old female healthy control there is a 40 year old female ME/CFS patient? Because if there is an age range of participants, say 25 to 65, then it stands to reason that there would be a range of performance levels, and the lower performing controls might just be older. It would be good to compare performance of a 55 year old control to a 55 year old ME/CFS patient, etc.
Thanks for your comment. It’s the latter explanation. They paired each of the 55 ME/CFS patients with a healthy control that has a similar age, sex and VO2 peak value at the first exercise test.
In an area where there are lots of results where patients tend to do worse than controls, but where there is no one measure that is good at separating patients from controls, it suggests that a multi-variable model might be worth exploring.
I’m afraid knowledge of the details of this and certainly the statistical approach to use is beyond my knowledge at the moment. In its simplest form, it would count how many variables an individual “failed on”/were below a threshold on and using this it might find that say 80% of patients but only 5% of controls “failed” on, say, five measures. But in most cases, some measures would be better at discriminating between patients and controls than others and you would have weightings for different variables.
An example I recall recently was how they developed a long Covid set of criteria where to qualify as a case, an individual had to score a certain total score based on adding up the presence of symptoms with some symptoms having heavier weightings.
I feel that two day CPET is an attempt at a vast oversimplification of the complex mechanism of ME/CFS. It would be better to observe the exact impact that two days of exercise had on all of the trialists for a longer period, as I suspect many would show their worst symptoms after more than 24 hours. My own symptoms typically peak after 48h. I might appear like a HC for two days, then collapse for the next four days.
I also doubt that it would be easy to ensure that every ME/CFS candidate is on their particular healthy phase on CPET day one. It’s just as likely that many were actually observed on two consecutive days of PEM – No doubt they suffered equally during both days of the test, hence little different in (poor) performance day 1 to day 2.
I agree. I’ve also heard from some participants that travelling to the research location was more of an effort than the CPET, so they were already overexerted on the first exercise test.